PROS O&D
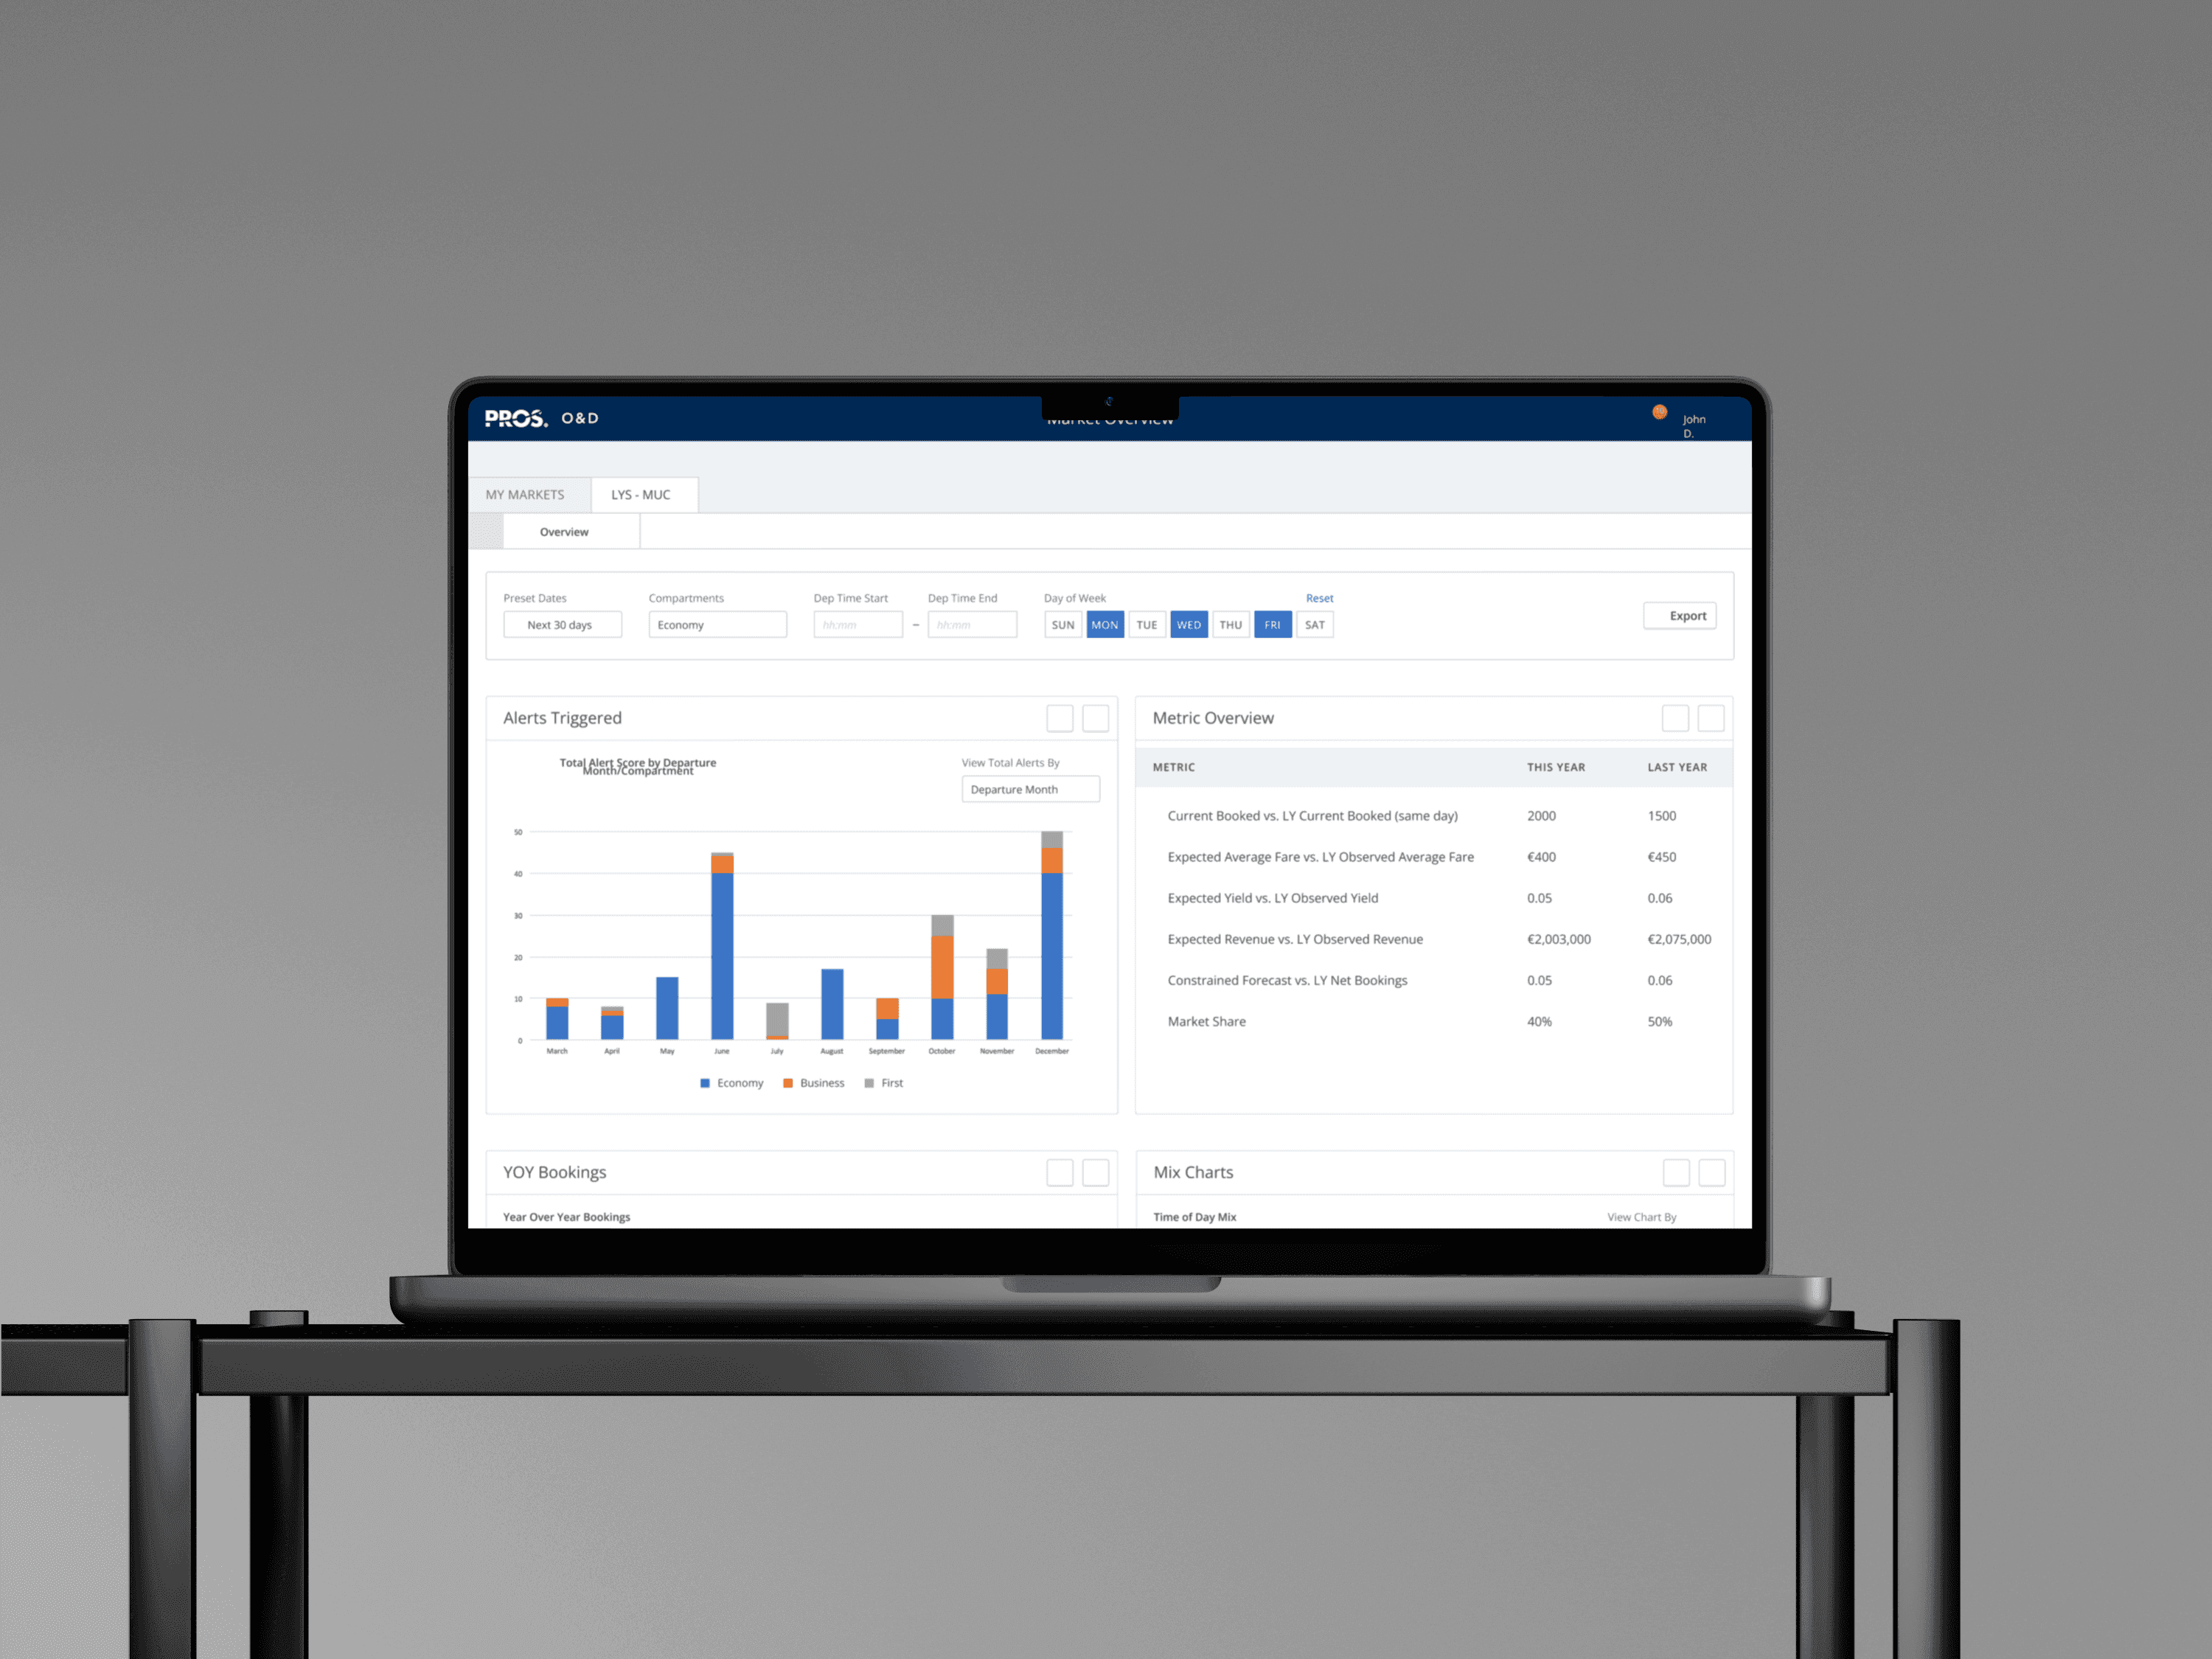
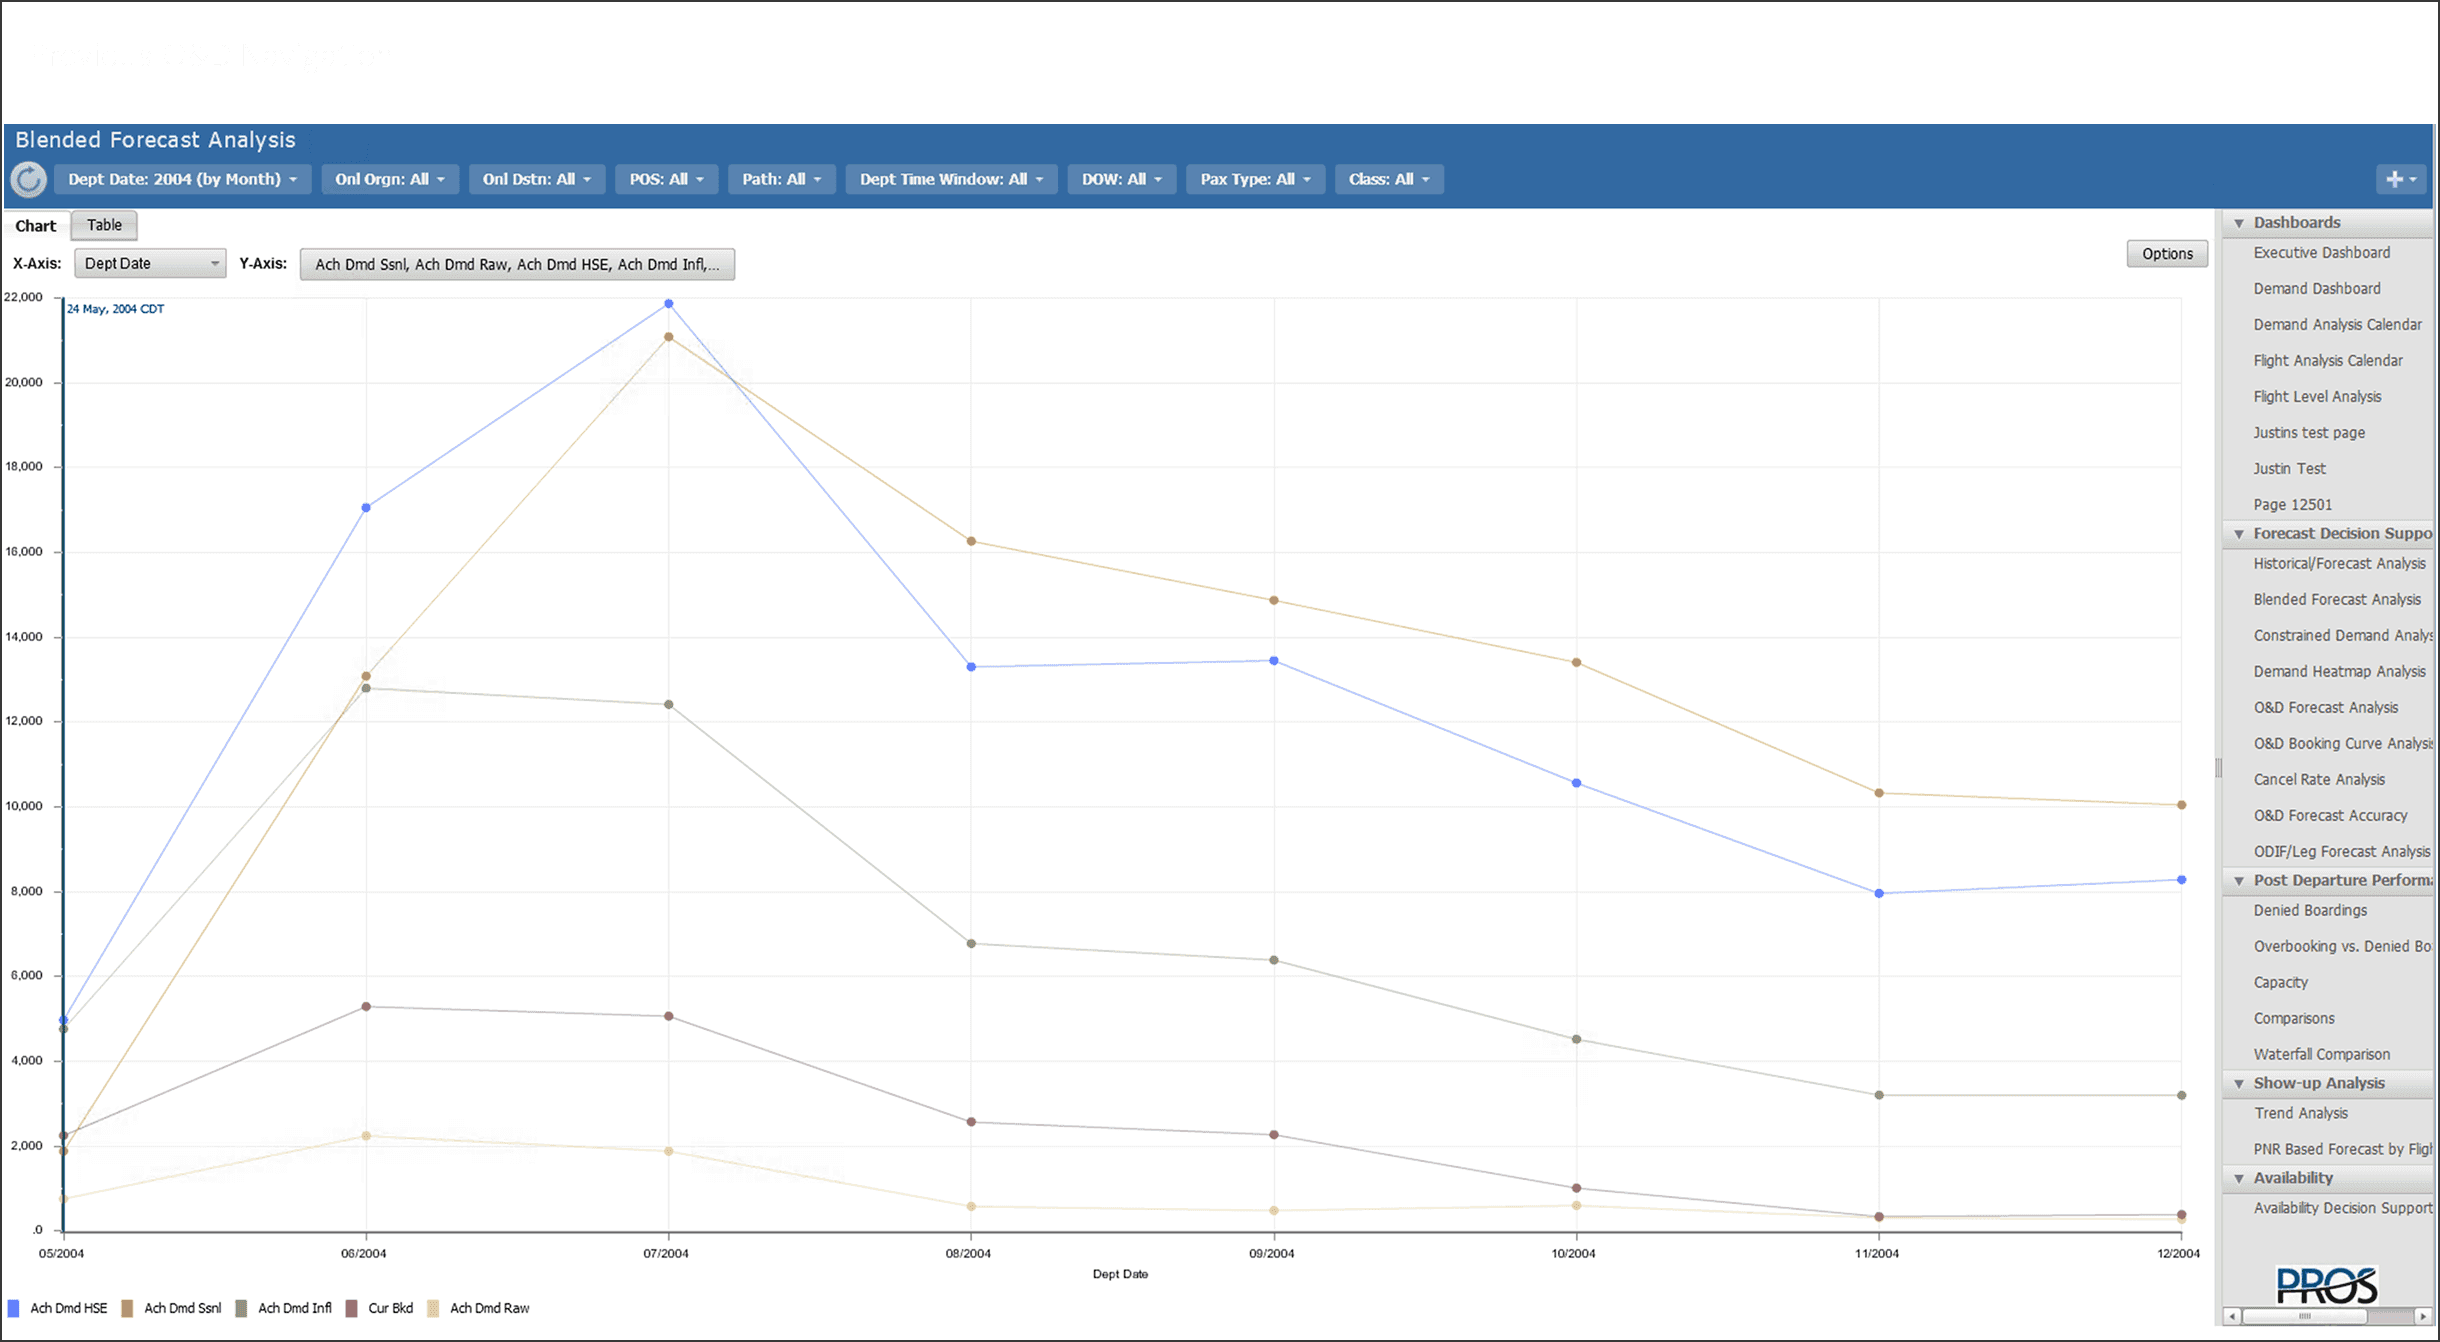
PROS's flagship revenue management tool, O&D, was built in 1985 on Adobe Flash. With Flash hitting end-of-life in 2017, a migration was already planned. The default plan: lift and shift, no user research, same product in a new container. I pushed for something different.
- Company
- PROS, 2018
- Role
- Lead UX Designer
- Duration
- 1 year
- Team
- 3 PMs · 11 Engineers
The challenge
So, what's the problem?
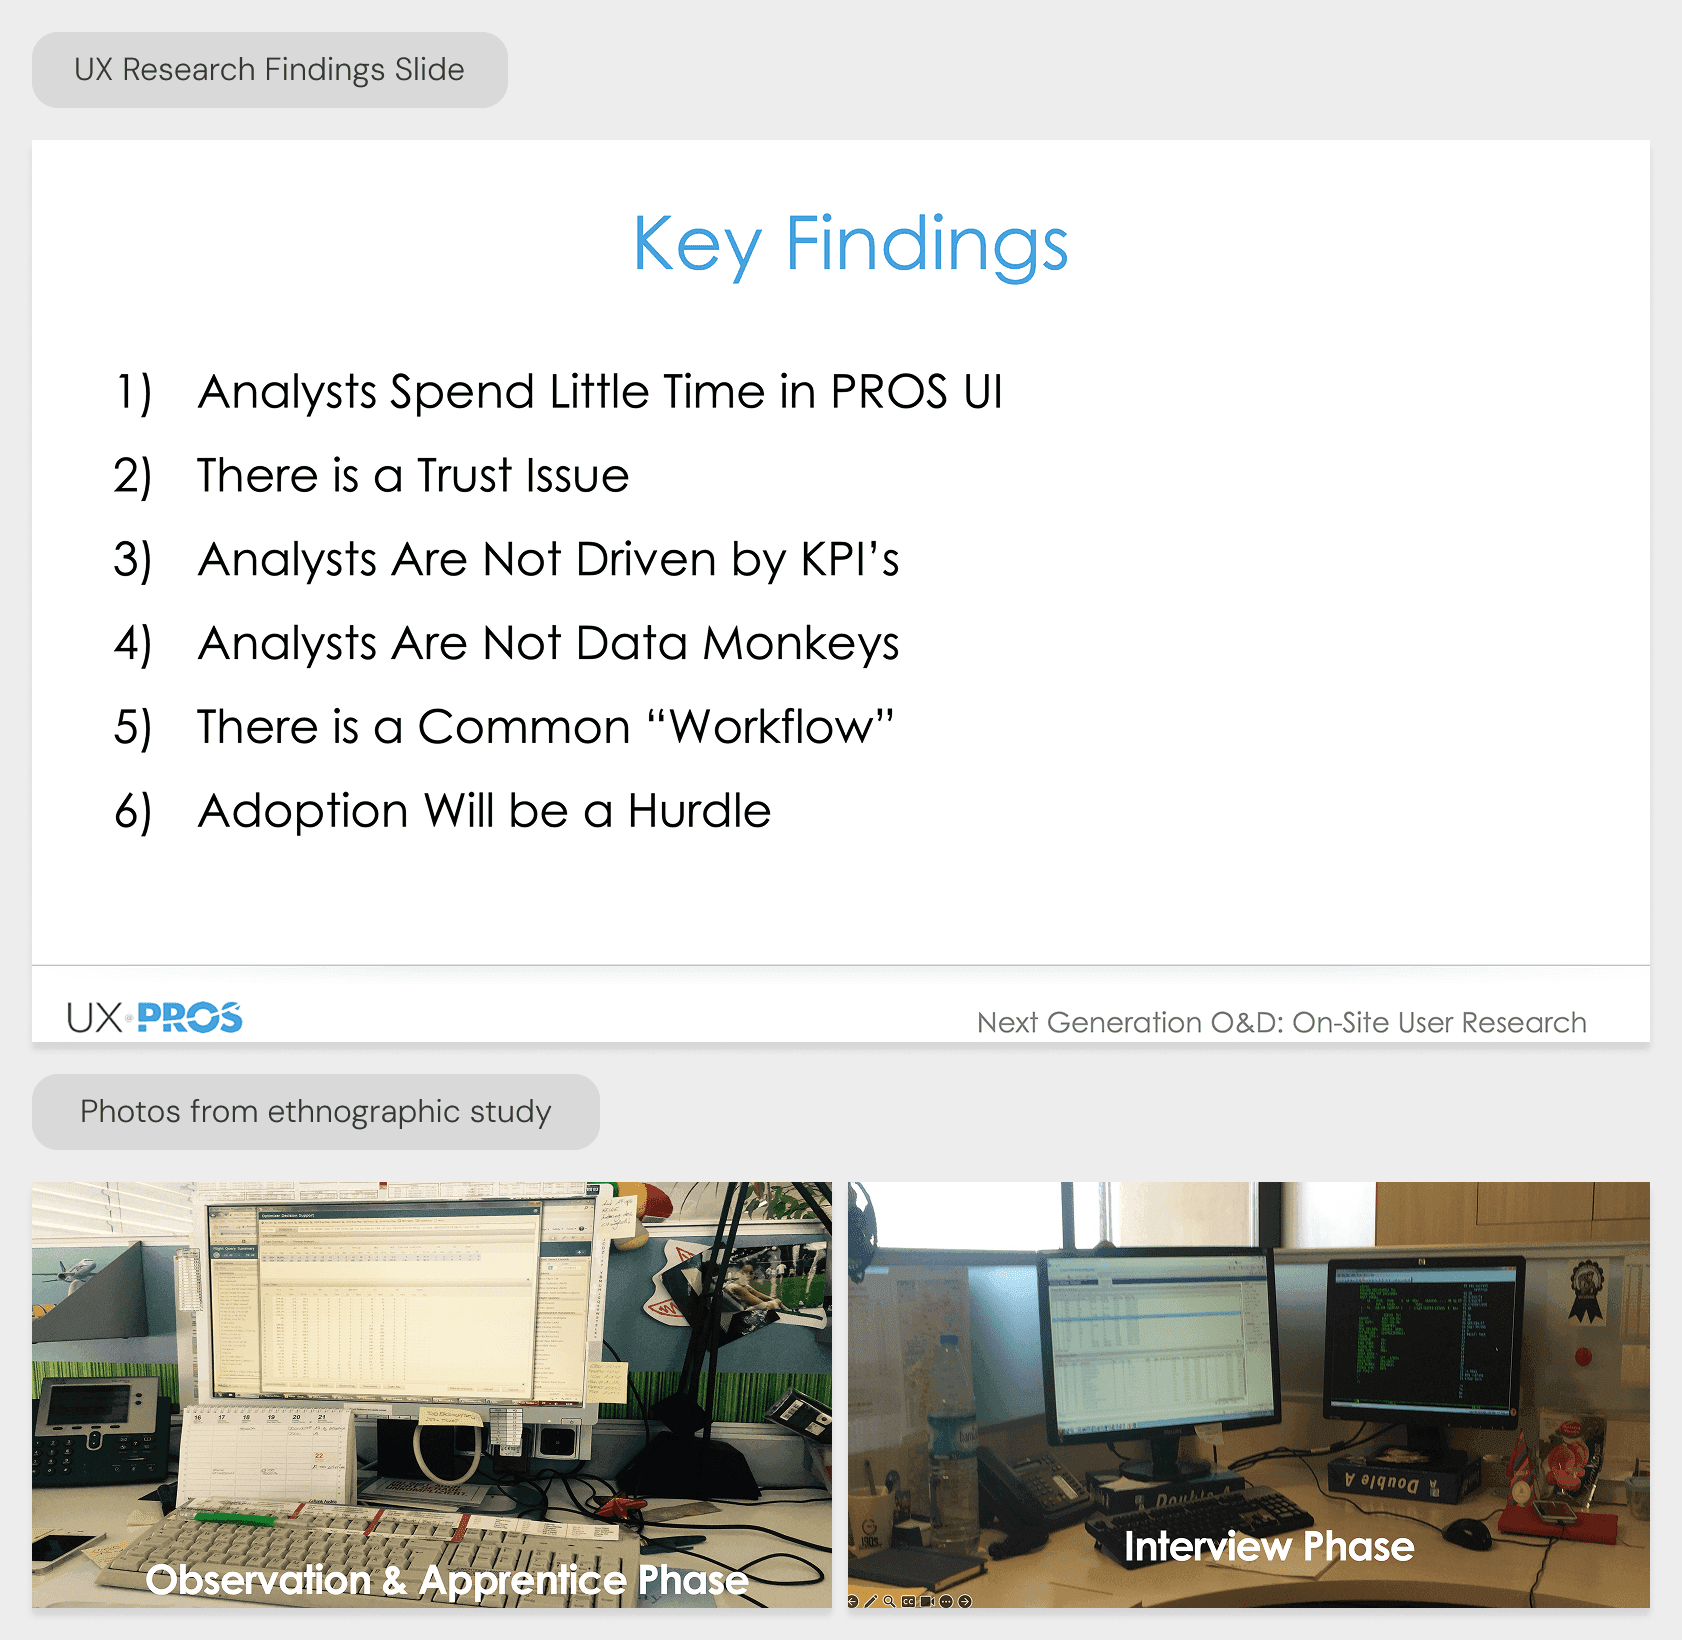
PROS had never talked directly to the analysts using the product. Requirements came from external SMEs. I made the case to Product leadership that skipping research wasn't saving time, it was carrying risk forward. I got buy-in for a worldwide customer research tour. We interviewed analysts across multiple airlines and countries. Three things came back that changed the project entirely.
Analysts at different airlines followed nearly identical workflows, which invalidated PROS's "everything accessible everywhere" navigation built for 100+ screens. Users maintained offline files and parallel tools to validate their own decisions, a sign they didn't trust the application's data. And they spent as little time in the UI as possible, scanning for anomalies and leaving. The product needed to be fast, transparent, and built around a real workflow, not around feature coverage. Those findings shifted the brief from feature-parity migration to workflow redesign. Executive buy-in followed the research.
How I approached it
1From insights to decisions
Building shared direction before committing to design
From insights to decisions
Building shared direction before committing to design
- Before moving to design, I ran a design workshop with PMs and engineers. The goal was to get diverse thinking on the table before anyone committed to a direction.
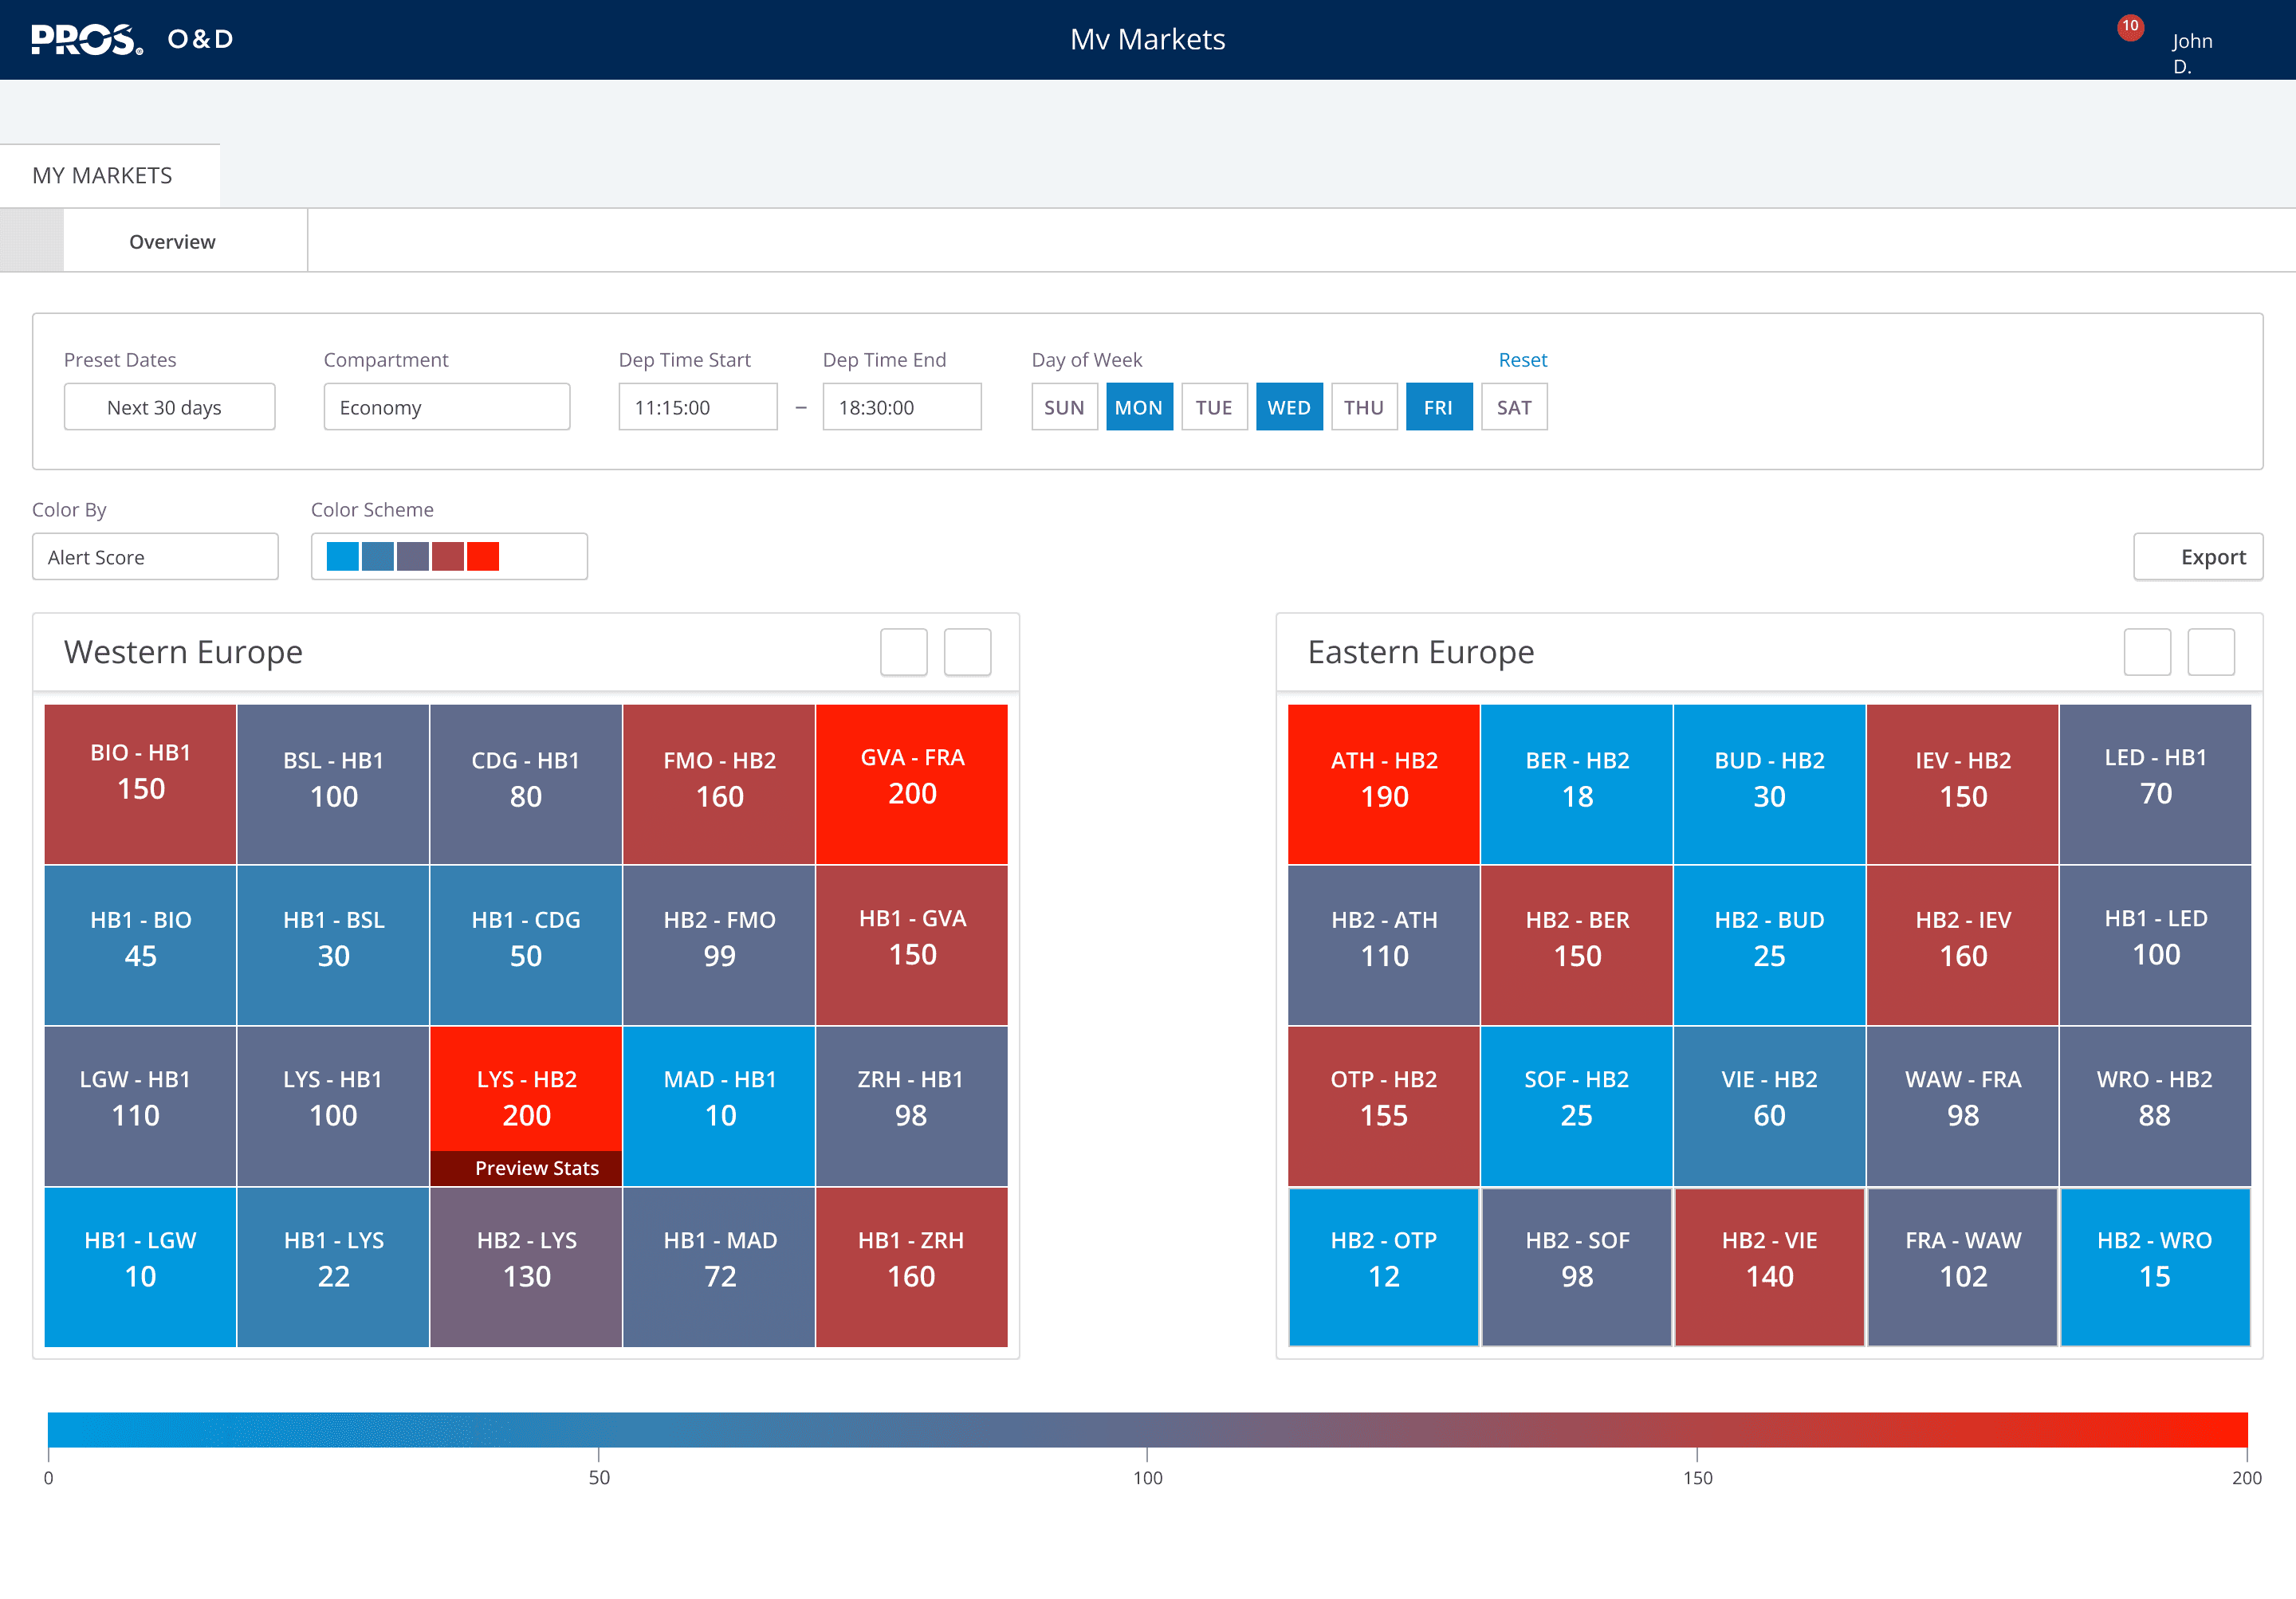
- The workshop produced two things worth keeping: a workflow-tailored approach to market analysis that shaped the overall IA, and the heat map visualization for the Availability page, which came directly out of the collaborative sketching.
- Neither would have surfaced from a solo design process.
2The UX Design
Navigation, prototype, and the Availability page
The UX Design
Navigation, prototype, and the Availability page
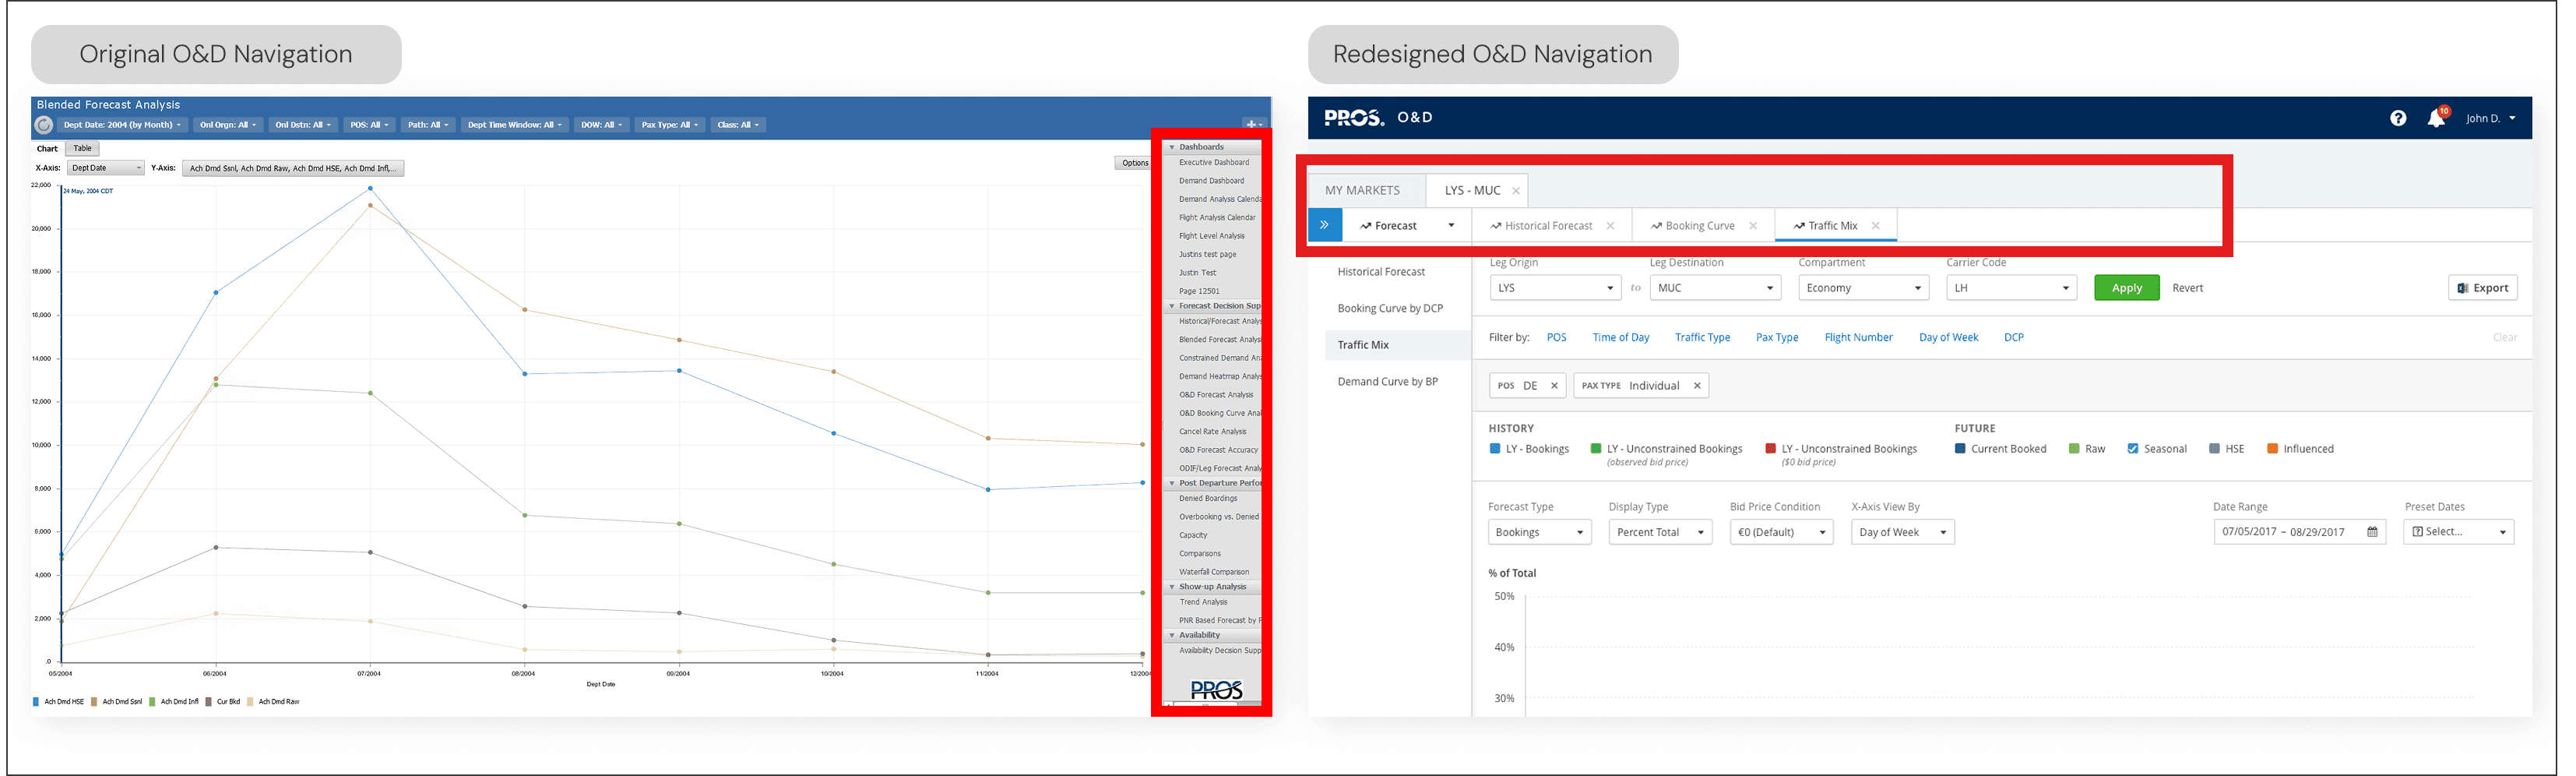
- Replaced the right-rail navigation with a two-level structure that encoded the actual analyst workflow into the interface.
- Built a working prototype to pressure-test the pattern with stakeholders before any development commitment. The prototype was high-fidelity: Axure RP with dynamic heat map visualizations driven by real Excel data.
- On the Availability page, the data density was extreme. Research showed analysts scan 5–10 markets looking for anomalies, not reading everything. Low availability means revenue loss, so speed matters. Designed color-coding by filter to make problems visible at a glance.
- Implemented colorblind-safe palettes across all 100+ screens — a gap the legacy product had never addressed.
- Used the PROS KIT design system to maintain consistency across the full screen count without slowing delivery.
From the process
The solution
Did it work?
The product launched in 2018. PROS could now reach price-sensitive airlines the on-premise model had excluded.
The more durable outcome was organizational. Product leadership shifted how they valued UX investment. Before this project, research was overhead. After it, research was how decisions got made. I got there by framing the investment in terms leadership already cared about: reducing risk, not improving design.
I also used the project to build the team's capability. The workshops weren't just ideation sessions. They were deliberate practice in research synthesis and collaborative decision-making. The designers and PMs who went through that process came out with a different instinct for how to work.
What it delivered
- 2018
- Product launchedPROS could now reach price-sensitive airlines the on-premise model had excluded
- 100+
- Screens deliveredConsistent design across the full screen count using PROS KIT design system
- Shifted
- How leadership valued UXBefore this project, research was overhead. After it, research was how decisions got made
- Built
- Team capabilityDesigners and PMs who went through the process came out with a different instinct for how to work
Key factors
Strategic Framing
Positioned research as business risk mitigation rather than design preference, securing executive buy-in
Collaborative Leadership
Used workshops to create shared ownership of design direction, reducing implementation friction
Evidence-Based Design
Let research insights drive decisions, building credibility for UX's strategic role
Systems Thinking
Leveraged design system to scale impact across 100+ screens efficiently
Cross-Functional Partnership
Partnered with Product and Engineering as strategic equals, not service providers
Reflection
PROS had never talked directly to the analysts using the product. Skipping research wasn't saving time — it was carrying risk forward. The research tour changed everything: the brief, the scope, and ultimately how the business valued UX investment.